Pierce County Housing Report Supply vs. Demand
Last week I talked about the shortage of houses for sale in Pierce County being notably below the demand and how this condition makes the home buying and selling experience a little testy for many. Buyers have to make decisions quicker than they might otherwise like to, sellers face tricky waters getting their price right, and the negotiation process can have some tension that both may prefer to be without.
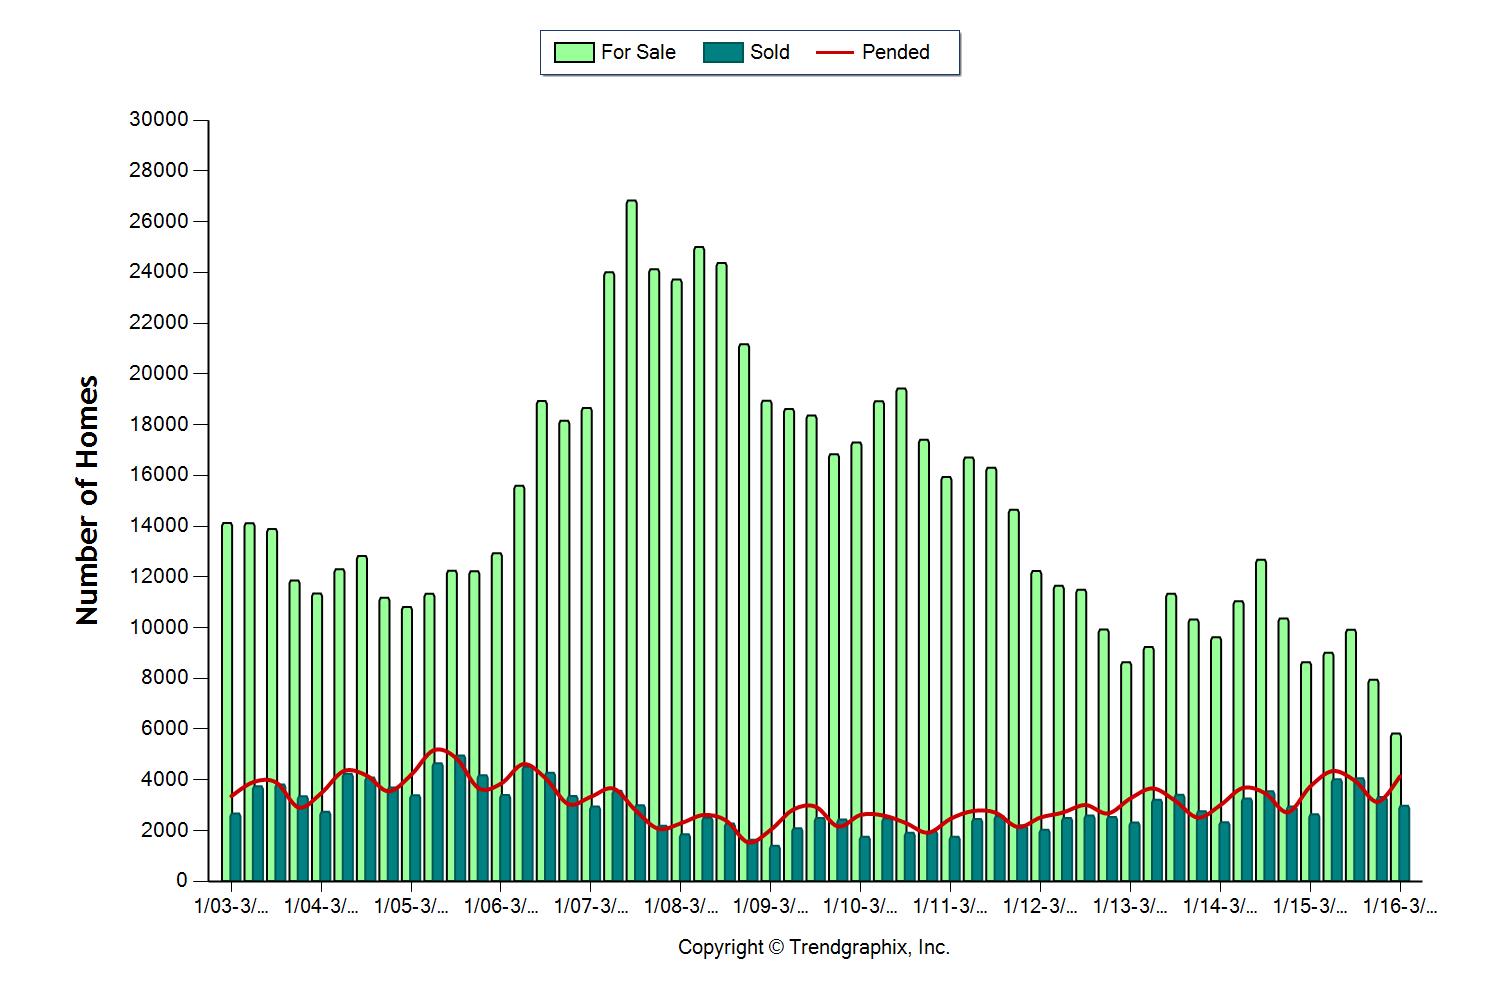
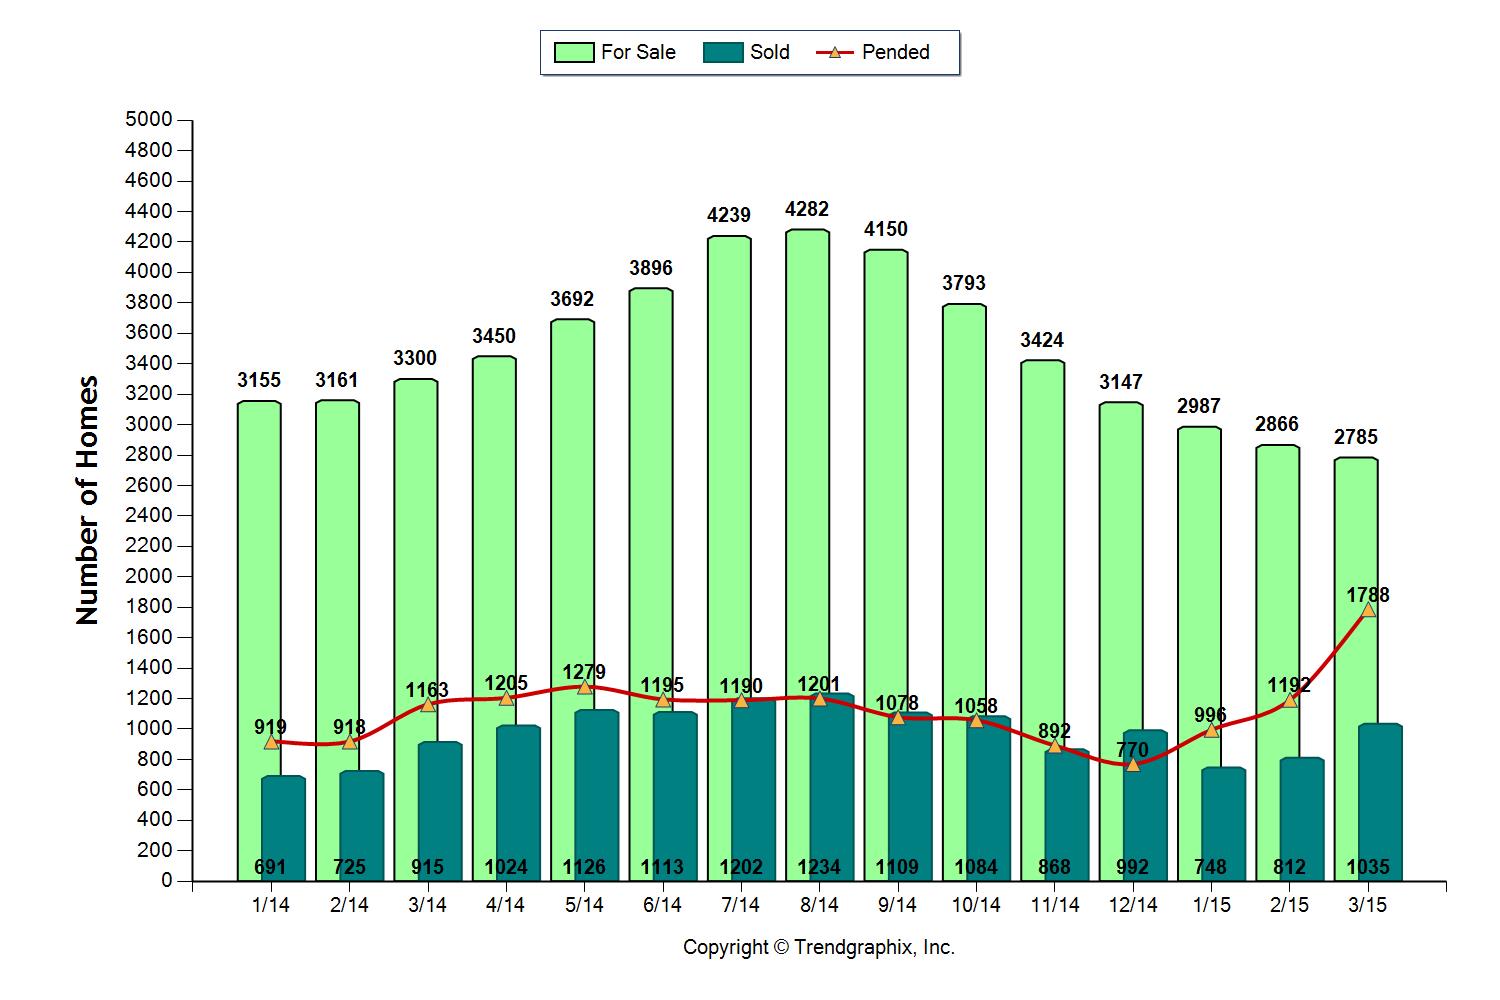
In the process of preparing that report I began to wonder; “Is demand really high or supply just super low?” I referenced some historical Pierce County housing data for perspective. The chart below represents 14 years of Pierce County housing activity. The bright green bars represent supply of homes; the dark green bars represent closings while the red line tracks Pending sales.
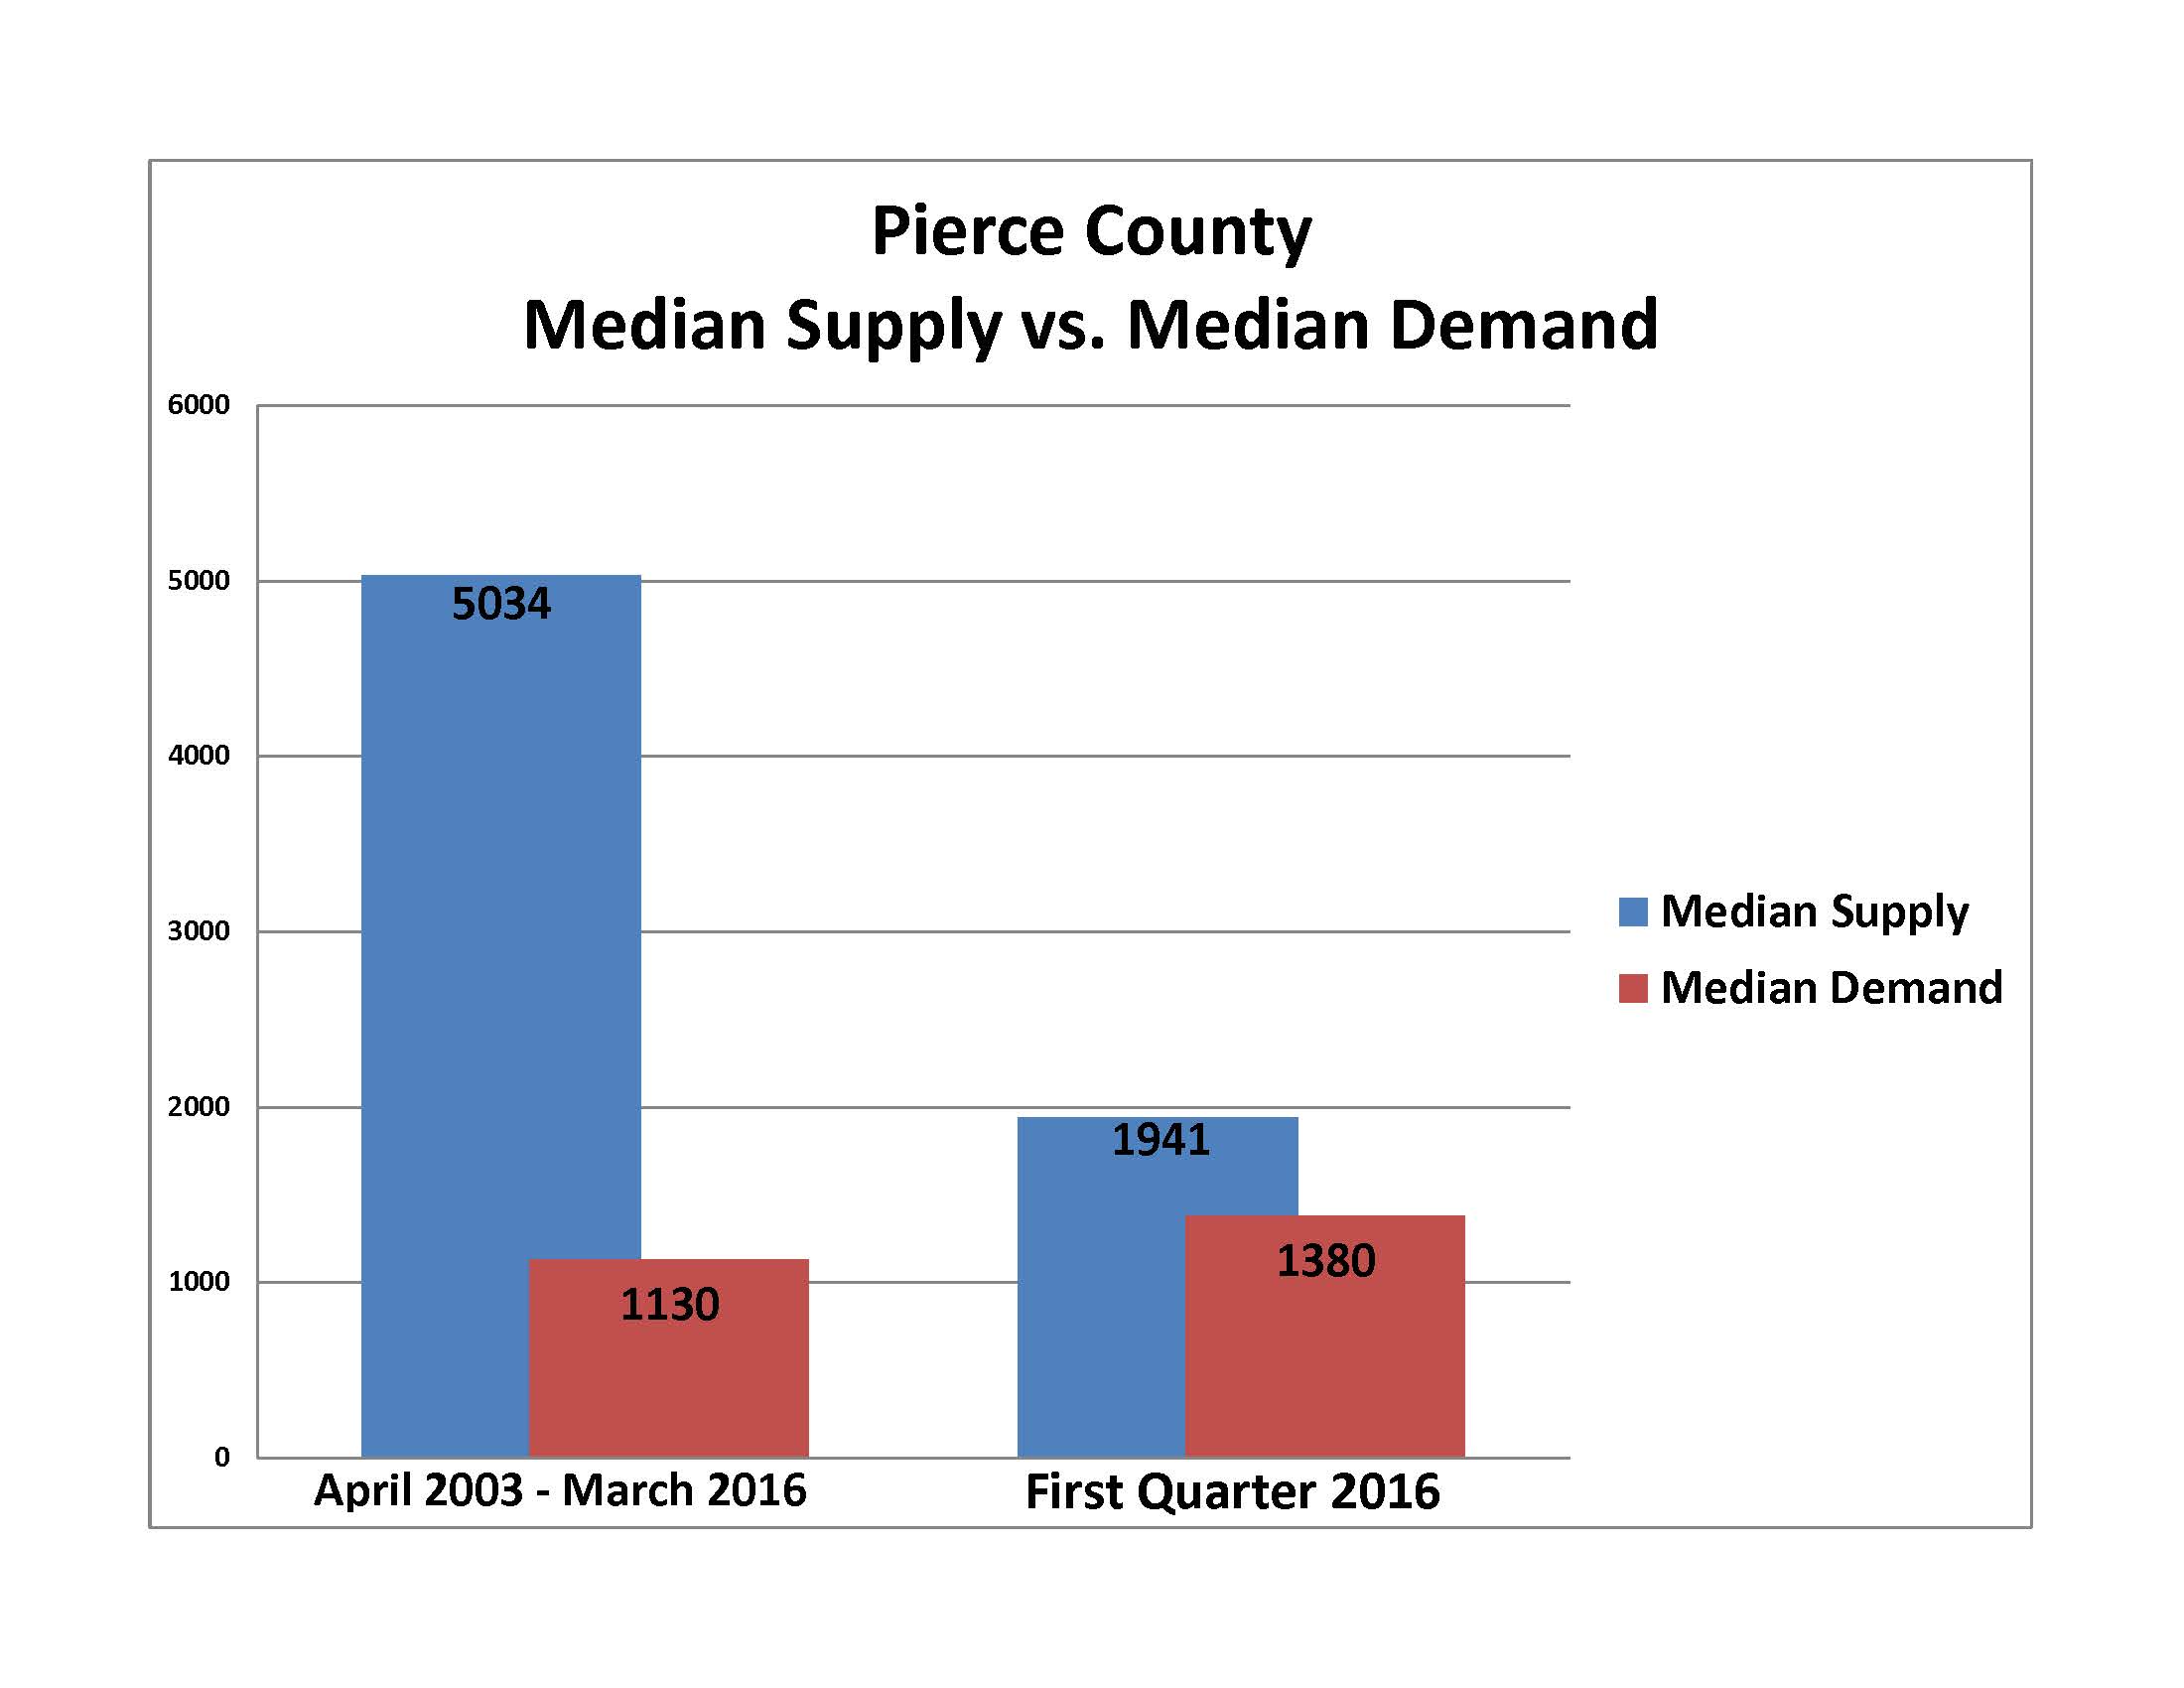
As soon as I prepared this graph the Pending line caught my attention, I call it the “Demand” line, and it is shown in red on this graph. When stepping back 14 years we can see there is certainly some fluctuation in the “Demand” line, but it looks relatively flat compared to the “Supply” line! Getting a little geeky I set out to measure the two, here’s what I learned after sifting through 14 years of data.
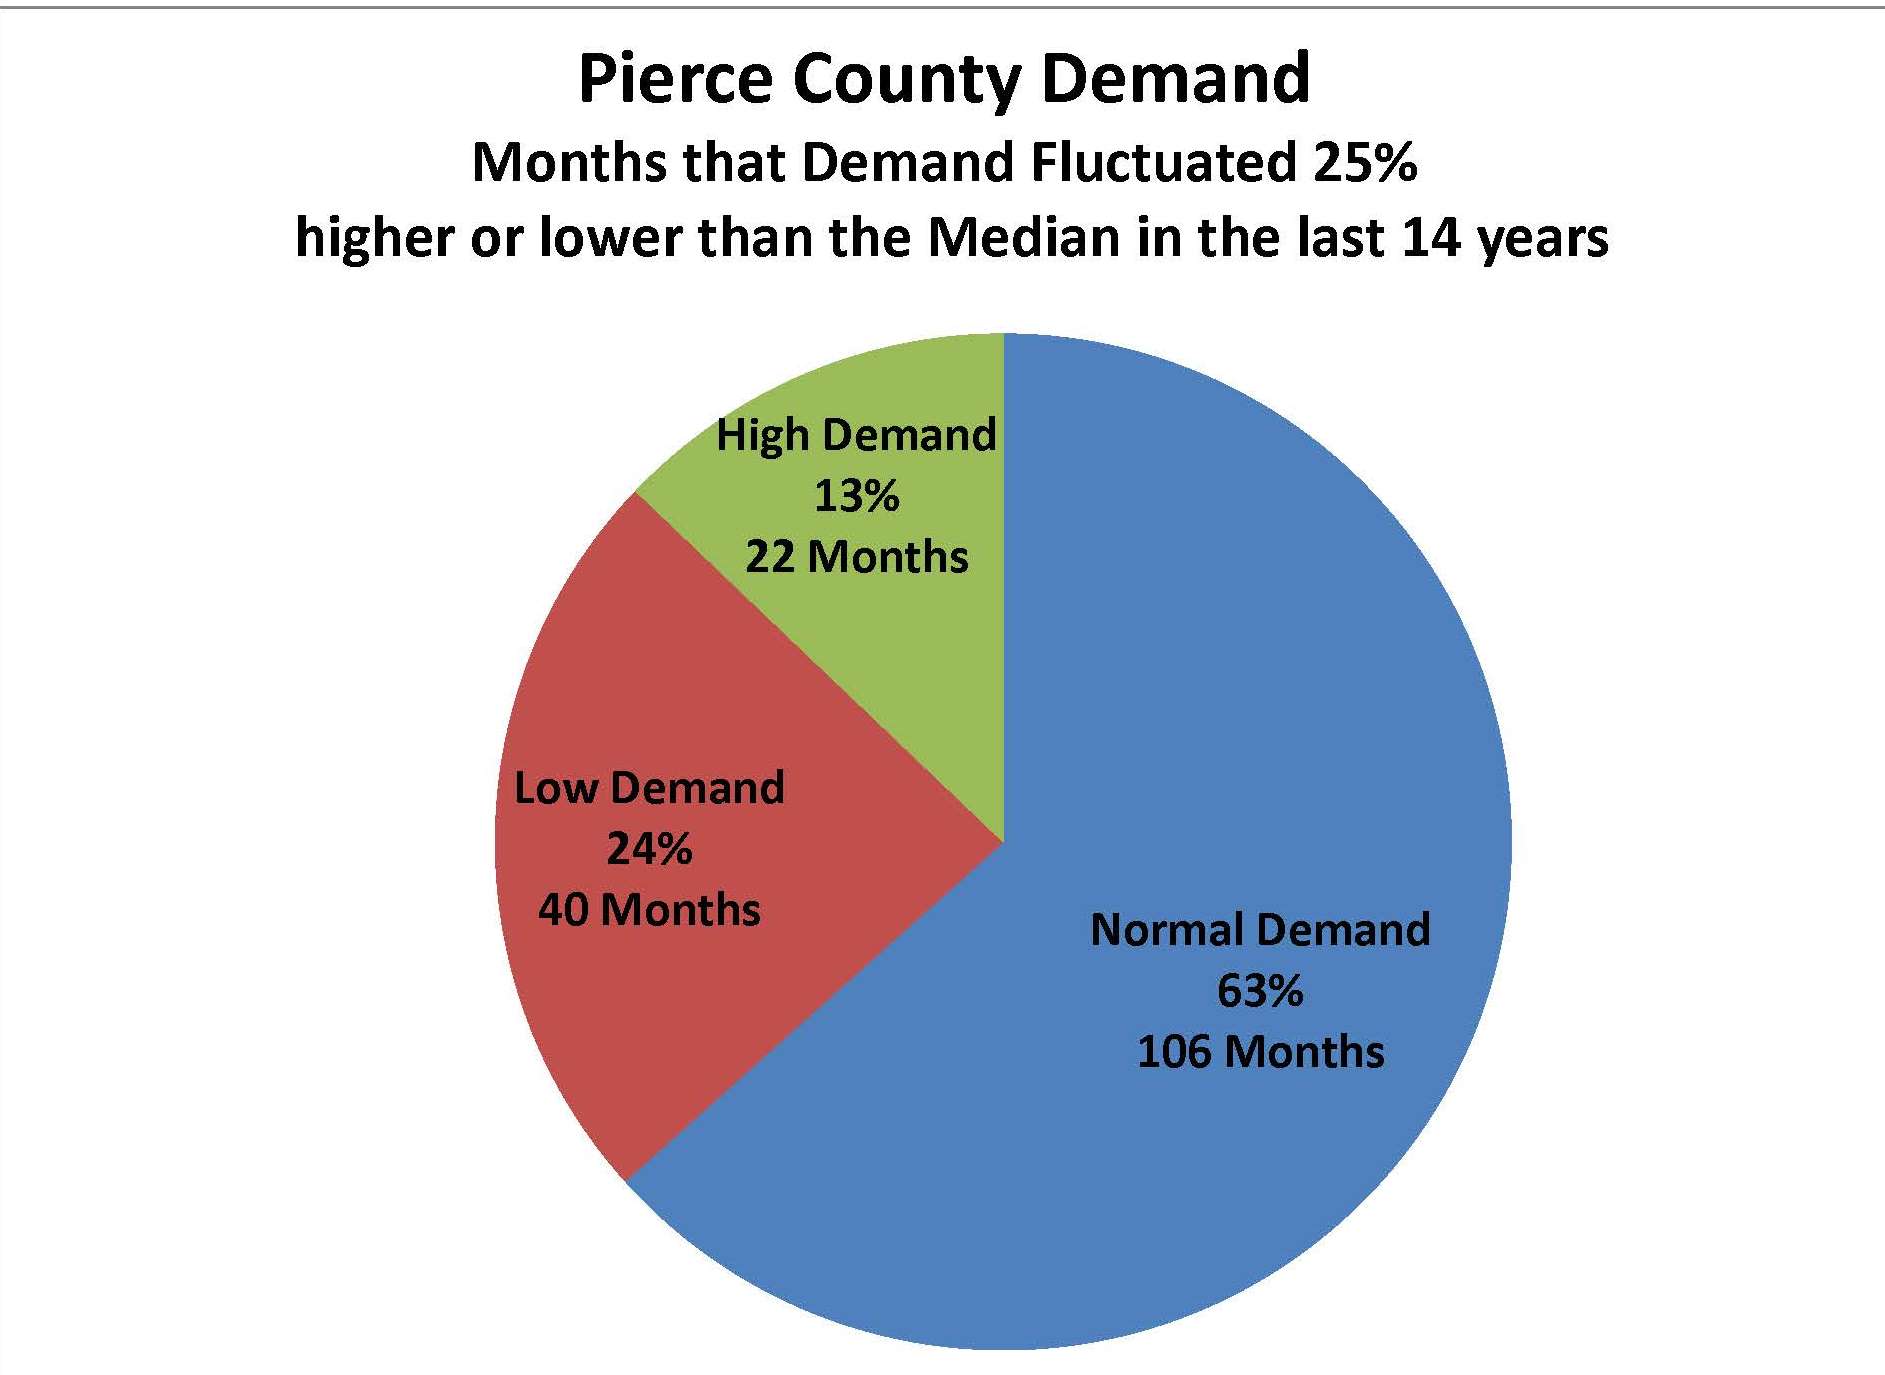
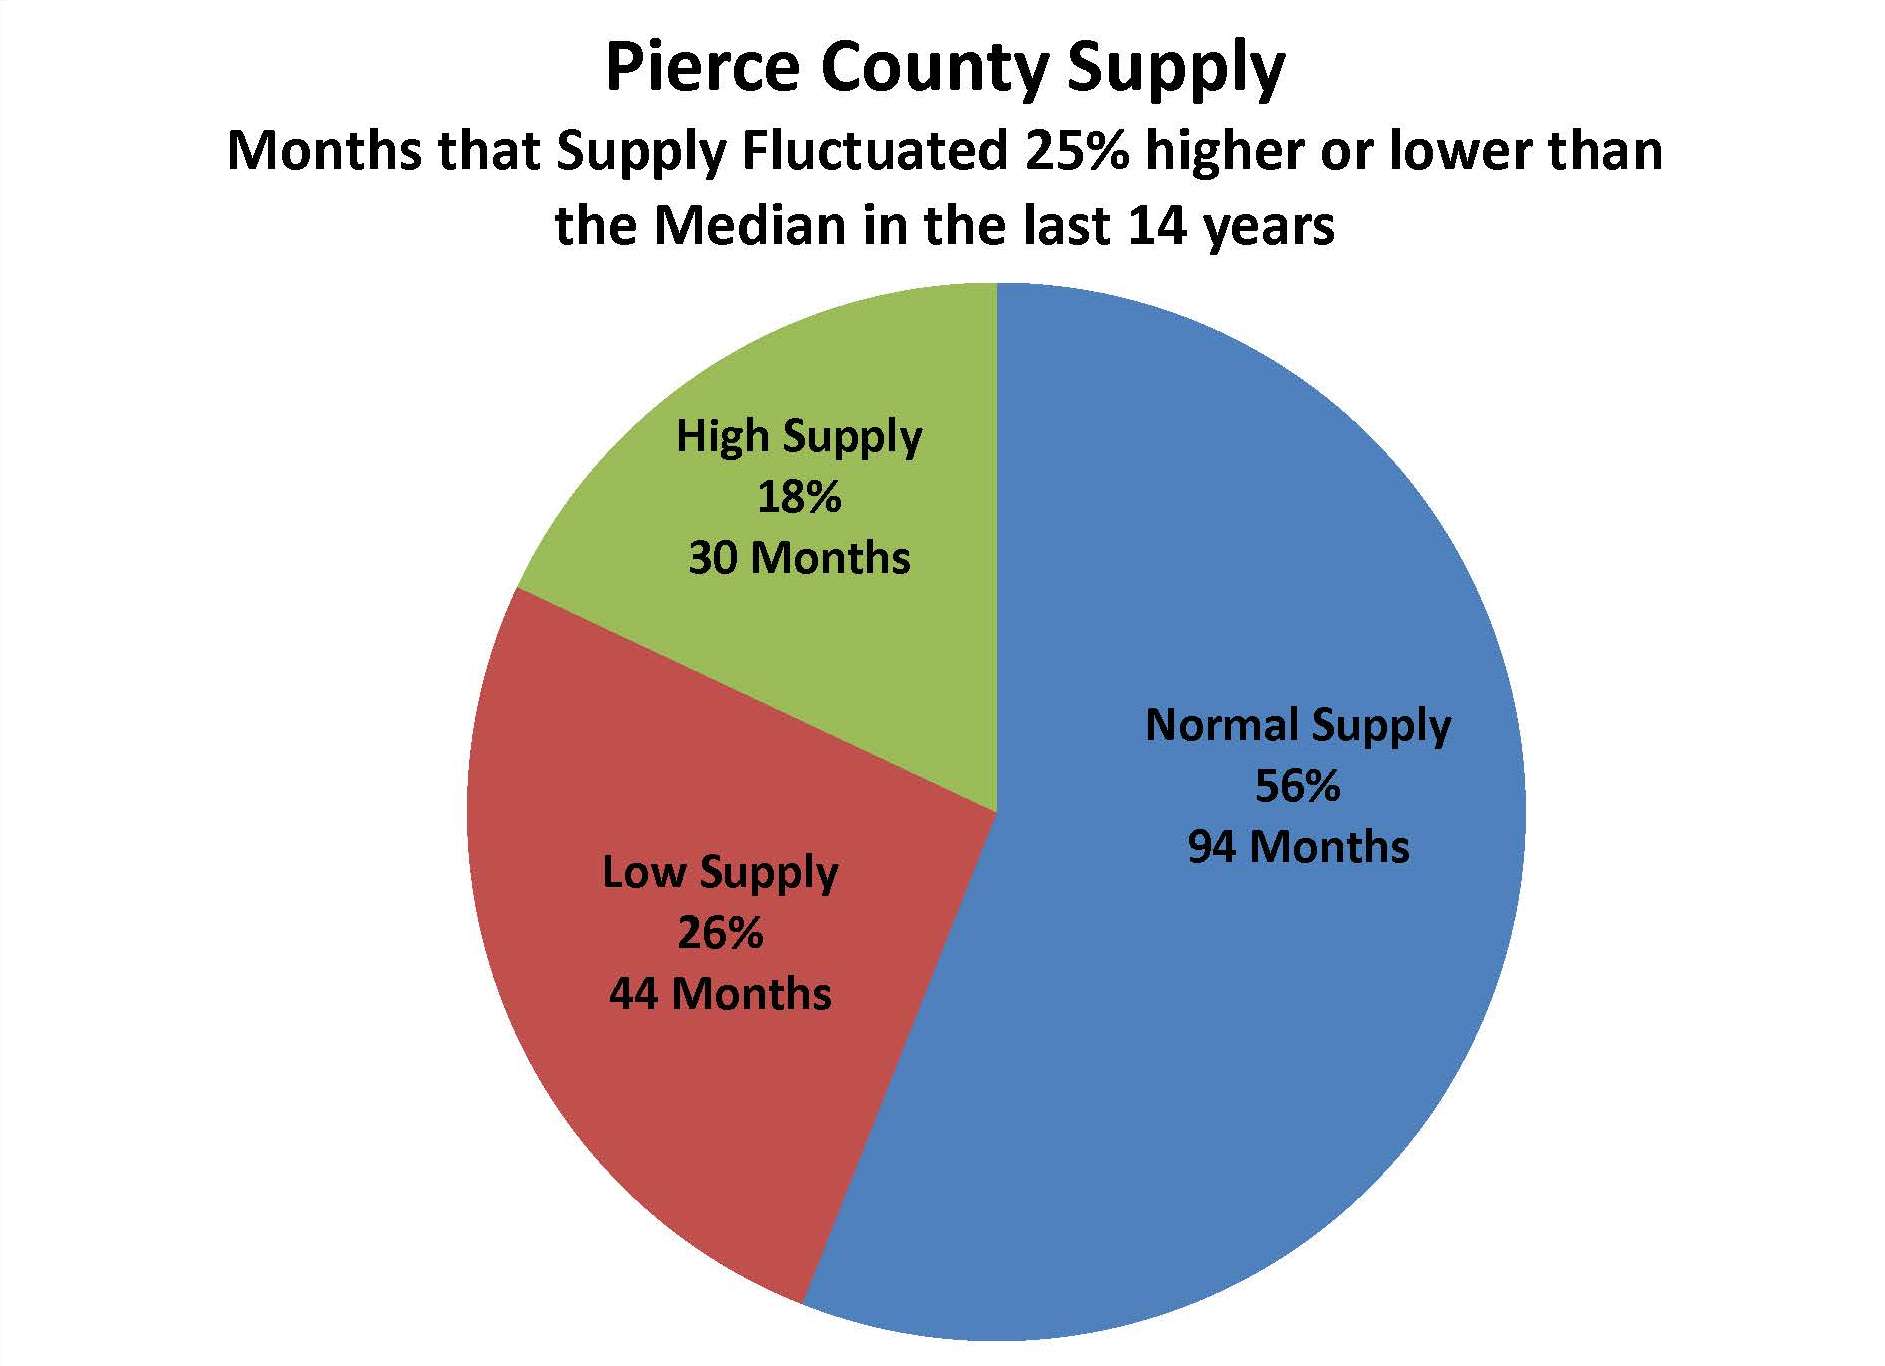
Next I wondered how often the demand or supply fluctuated higher or lower than 25% of the median. I wanted to know what, if anything is out of whack with our market “today”.
As you can see, in the last 14 years 63% of the time demand is within 25% of the median, and surprisingly has only been more than 25% above the median 22 out of 168 months (13%). Currently, demand for Pierce County housing as measured by 1st Quarter 2016 is in the high side of the “Normal” range. At 1,380 Pending sales it is 22% above our 14 year median. Not the same story for supply.
Our 1st Quarter supply average is 1,941 which is 61% below the median. Insert shocked face – here! – Pierce County is low on inventory! What is extraordinary about right now is the inventory has actually been in this “more than 25% below median” status for 29 of the last 36 months. Additionally, while I earlier stated that the 1st Quarter average demand is within the “norm”, if we only look at March demand it is 54% above the median making it one of the highest demand months in 14 years.
So what are we saying here?
Even though the market feels like there’s an extraordinary amount of pressure it’s been like this 80% of the last 3 years. March has us feeling market tensions in an exaggerated way due to a spike in demand along with the chronic low supply of homes we have been living with. It is also important to remember that the conditions described here are going to vary (sometimes a lot!) depending on where and what price range in Pierce County you are looking. This is one more reason why it is so important to have a Realtor at your side that can show you the #’s for your area. There are opportunities to sell into a High Demand/Low Supply sector and buy into a Normal Demand/Normal Supply sector. More on that next time!
First Quarter 2015 Pierce County Housing Report
We appear to be in for a wild ride in 2015 when it comes to the Pierce County Housing Market! So how do you navigate it if you are a seller?! What are the best strategies for a Buyer to get the home they really want? I'll discuss that and more in this article but as always let's start with the Pierce County numbers as of March 31st.
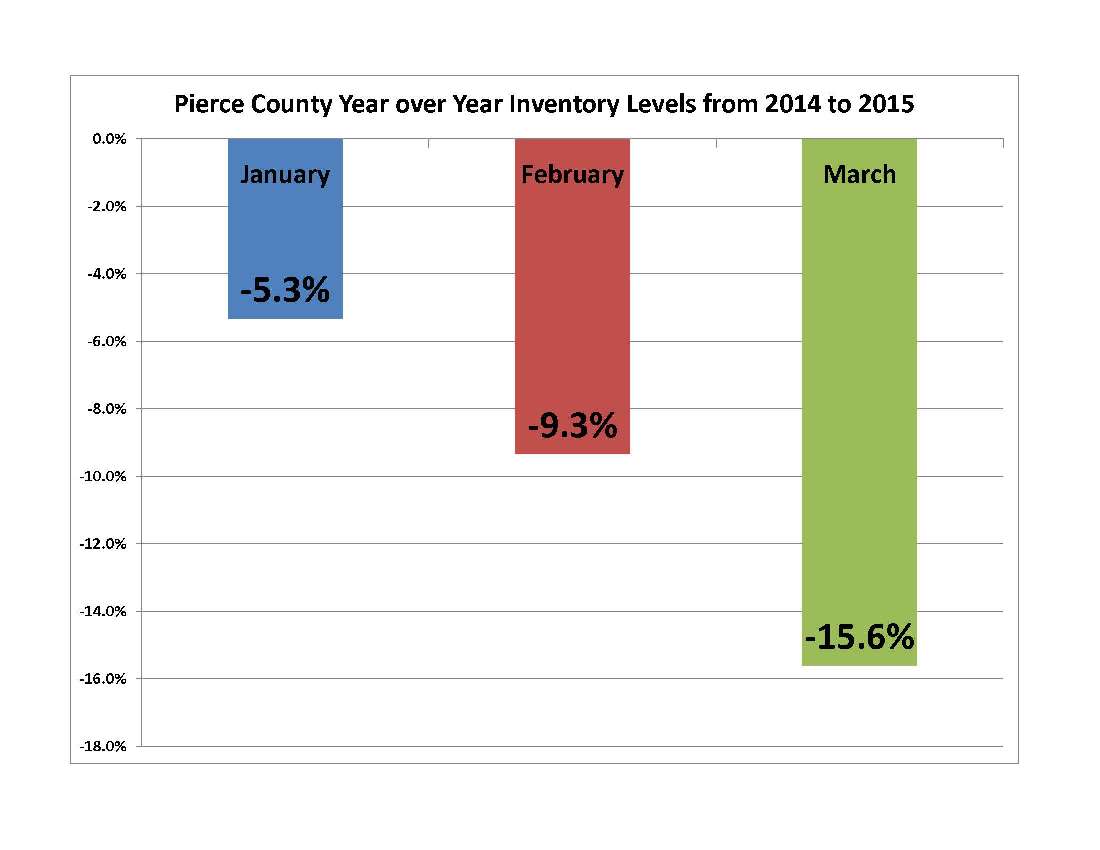
Inventory – DOWN – 15.6%
Closings – UP – 13.1%
Median Price – UP – 8%
New Pending Contracts – UP – 53.7%
These Year over Year numbers tell us the market is hot, in fact the Months of Inventory (MOI) is at 2.7 based on last month's closed sales. This is the lowest since Q3 of 2005. Anytime the month's worth of inventory dips below 3 months we have a market environment that favors sellers and encourages price appreciation. Also, year over year inventory levels have been declining steadily in Pierce County so far this year.
The primary reason for these dramatic declines comes as no surprise…Pierce County home buyers have been busy! There may not have been much snow in the NW mountains this year but our Pending home sales chart looks like a ski jump with Pending sales up 33% for Q1! Inventory is the biggest key to how our market plays out for the balance of 2015.
So inventory is down and sales volume is rocketing. "If I want to sell my house I can ask whatever I want and buyers will flock to my door…right?!?" Not so fast! The answer is…."It depends". Turns out, like so many things in the world of statistical sound bites, there are some distinct differences in the experience you can expect as a buyer or seller depending on what price range you are in. Bear with me as I set this up.
There are 2 data points when evaluating a market that are, IMHO, the most valuable predictors of what to expect as a buyer or a seller. One is the Sales Ratio; I explained the Sales Ratio in a blog last year, if you want to refresh you can link to it here . In a nutshell 55% is a balanced market, the higher the sales ratio number, the hotter the market, and the more likely things are in favor of the seller. The second number is Months of Inventory (MOI), with this indicator the lower the number, the more likely is that sellers are in control. Low MOI says at the current sales pace the market will "run out" of inventory if new properties don't come available or demand slows down.
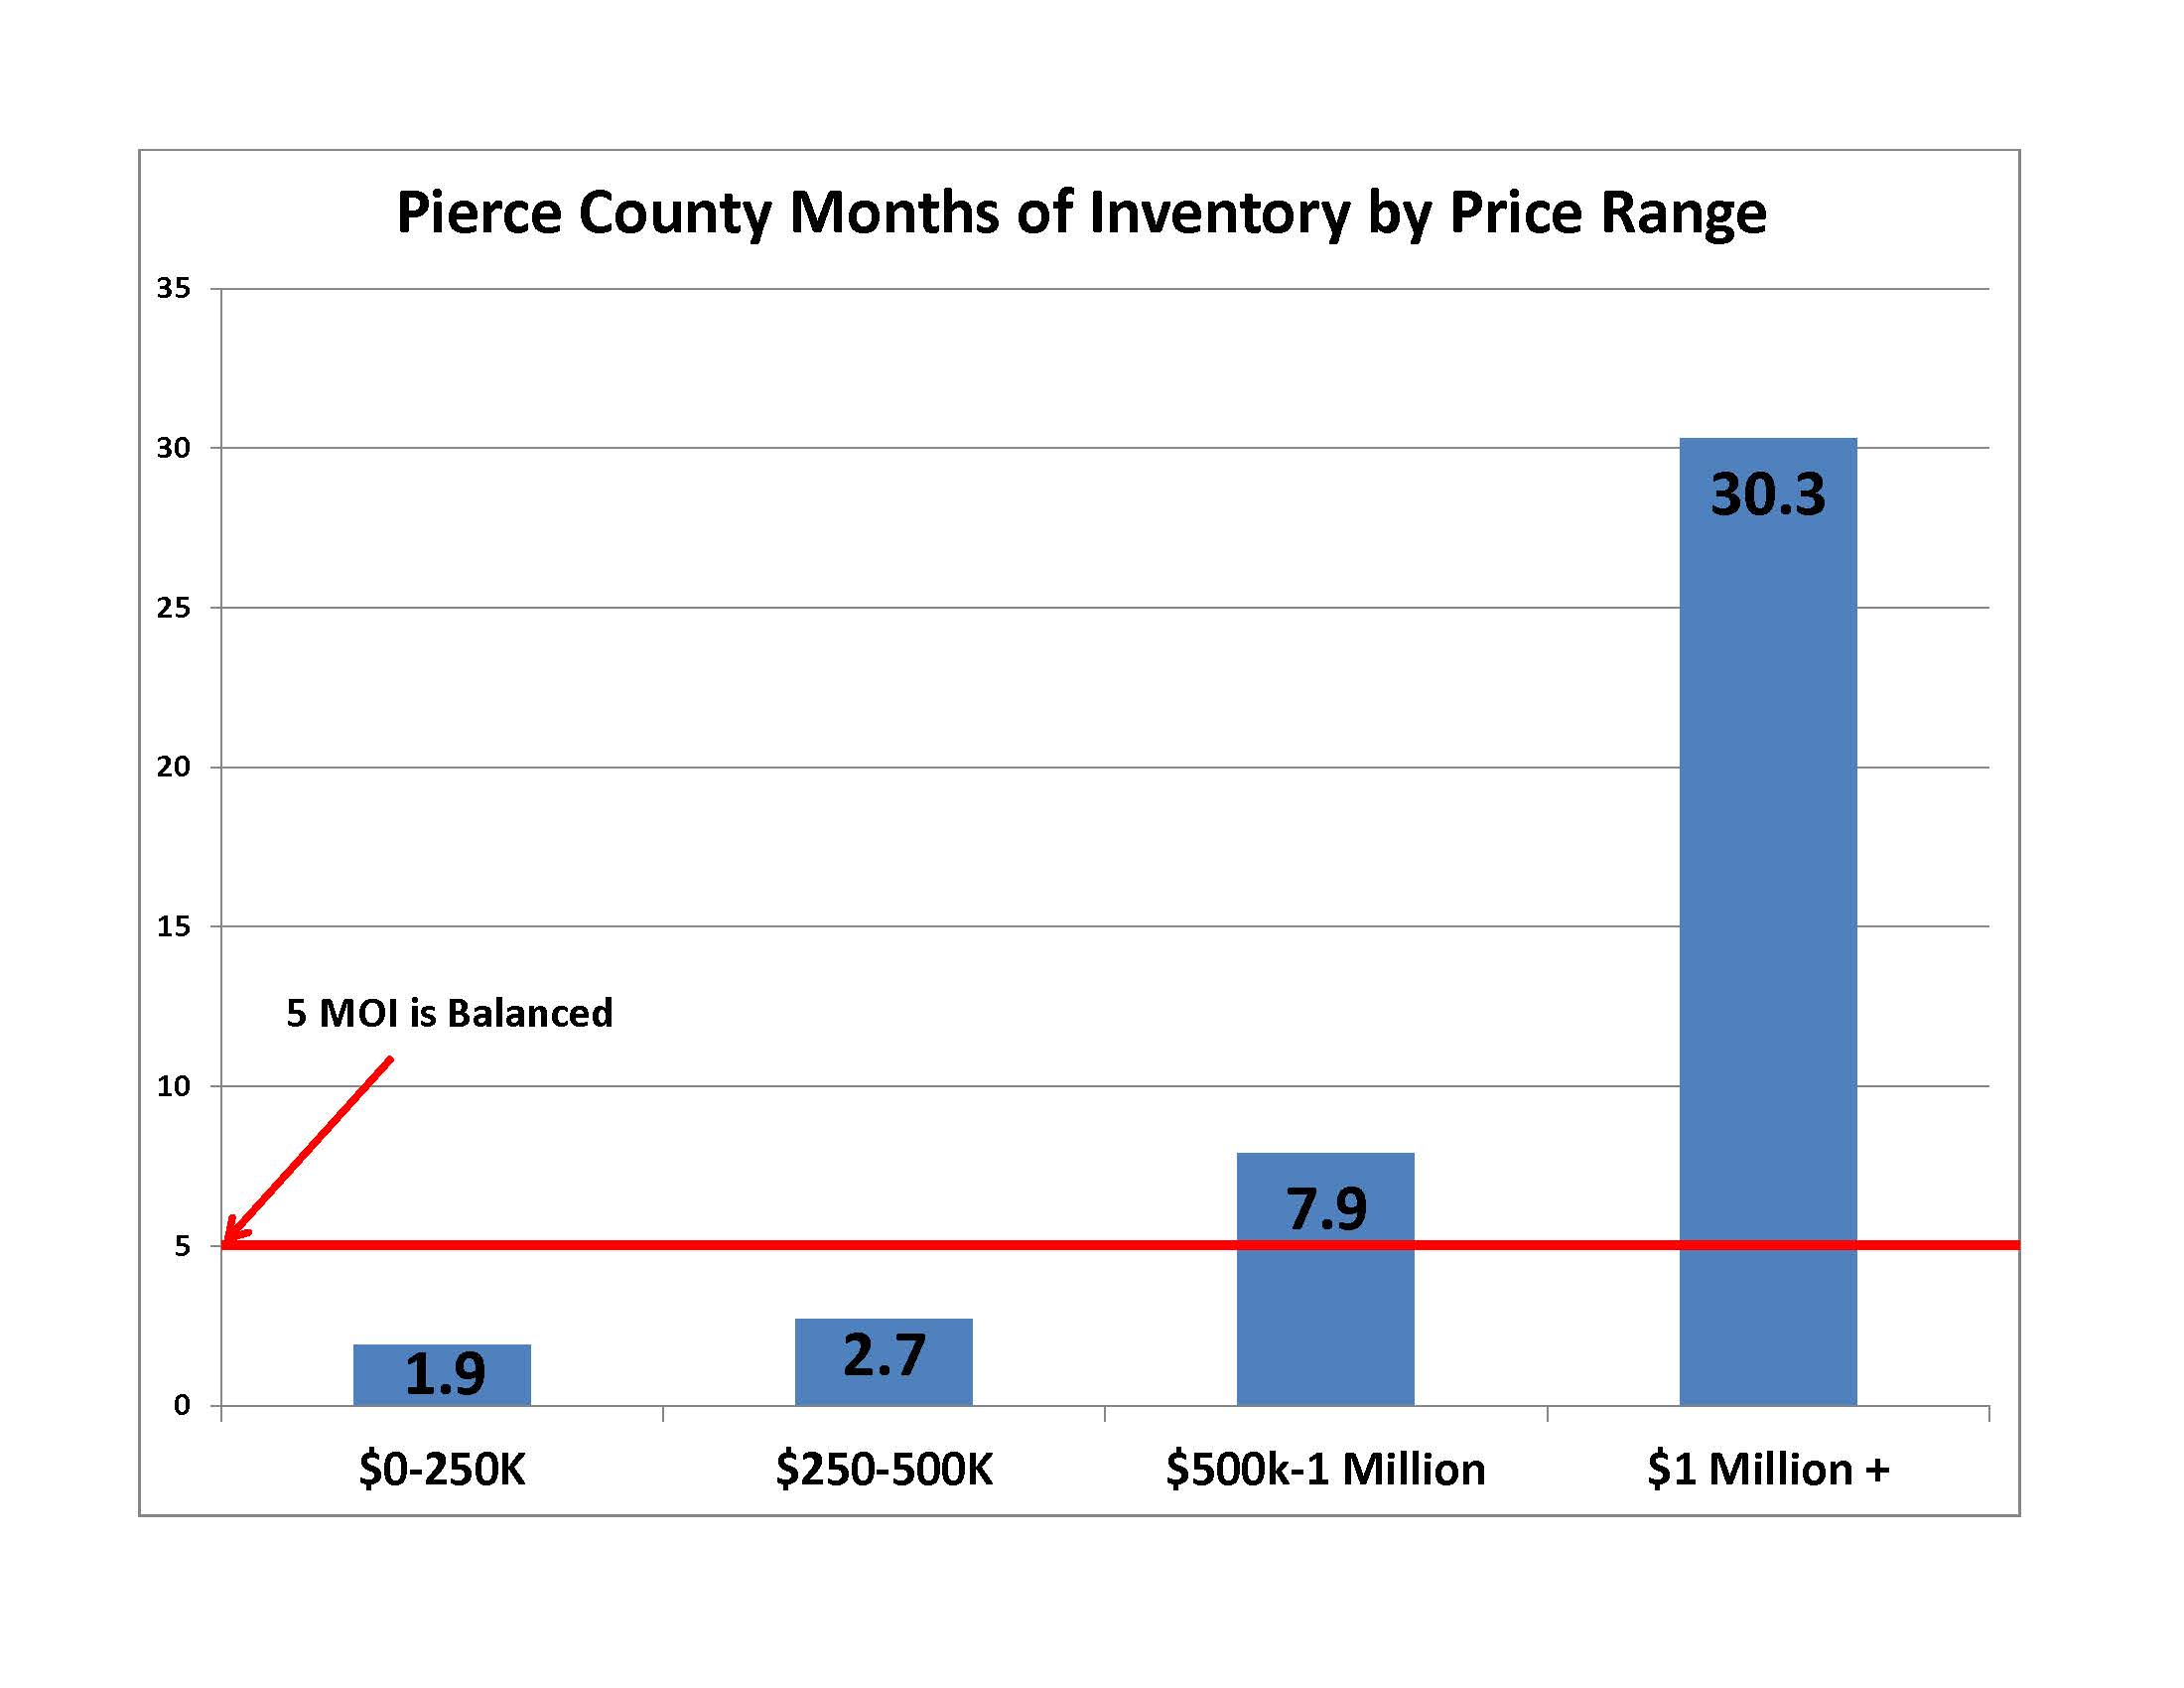
Overall PC has a sales ratio of 64% and MOI of 2.7. Both numbers tip in favor of sellers. Combined with the trends discussed in my opening remarks you'd think it's time for prices to move higher across the board. If you are working with homes under $500,000 you'd be absolutely right..you may even be accused of understating the situation, but if the home is over $500,000 it may require a closer examination. Take a look at the following;
Millennial buyers, first time buyers, investors, and more are super heating the market under $250,000. I would argue that a 90% sales ratio is not even sustainable, prices have to increase to temper the demand and allow the inventory level of only 1.9 months supply to eventually come back in line. A buyer in this price range needs to choose a broker well networked and steeped in local knowledge. One that is plugged into technology that receives quick market alerts and is accessible; able to move quickly for you when good properties come available. In this price range the broker needs to be able to advise you on how to groom your offer for greater likelihood of acceptance without giving away important rights you need as a buyer and ensuring your transaction is financially safe.
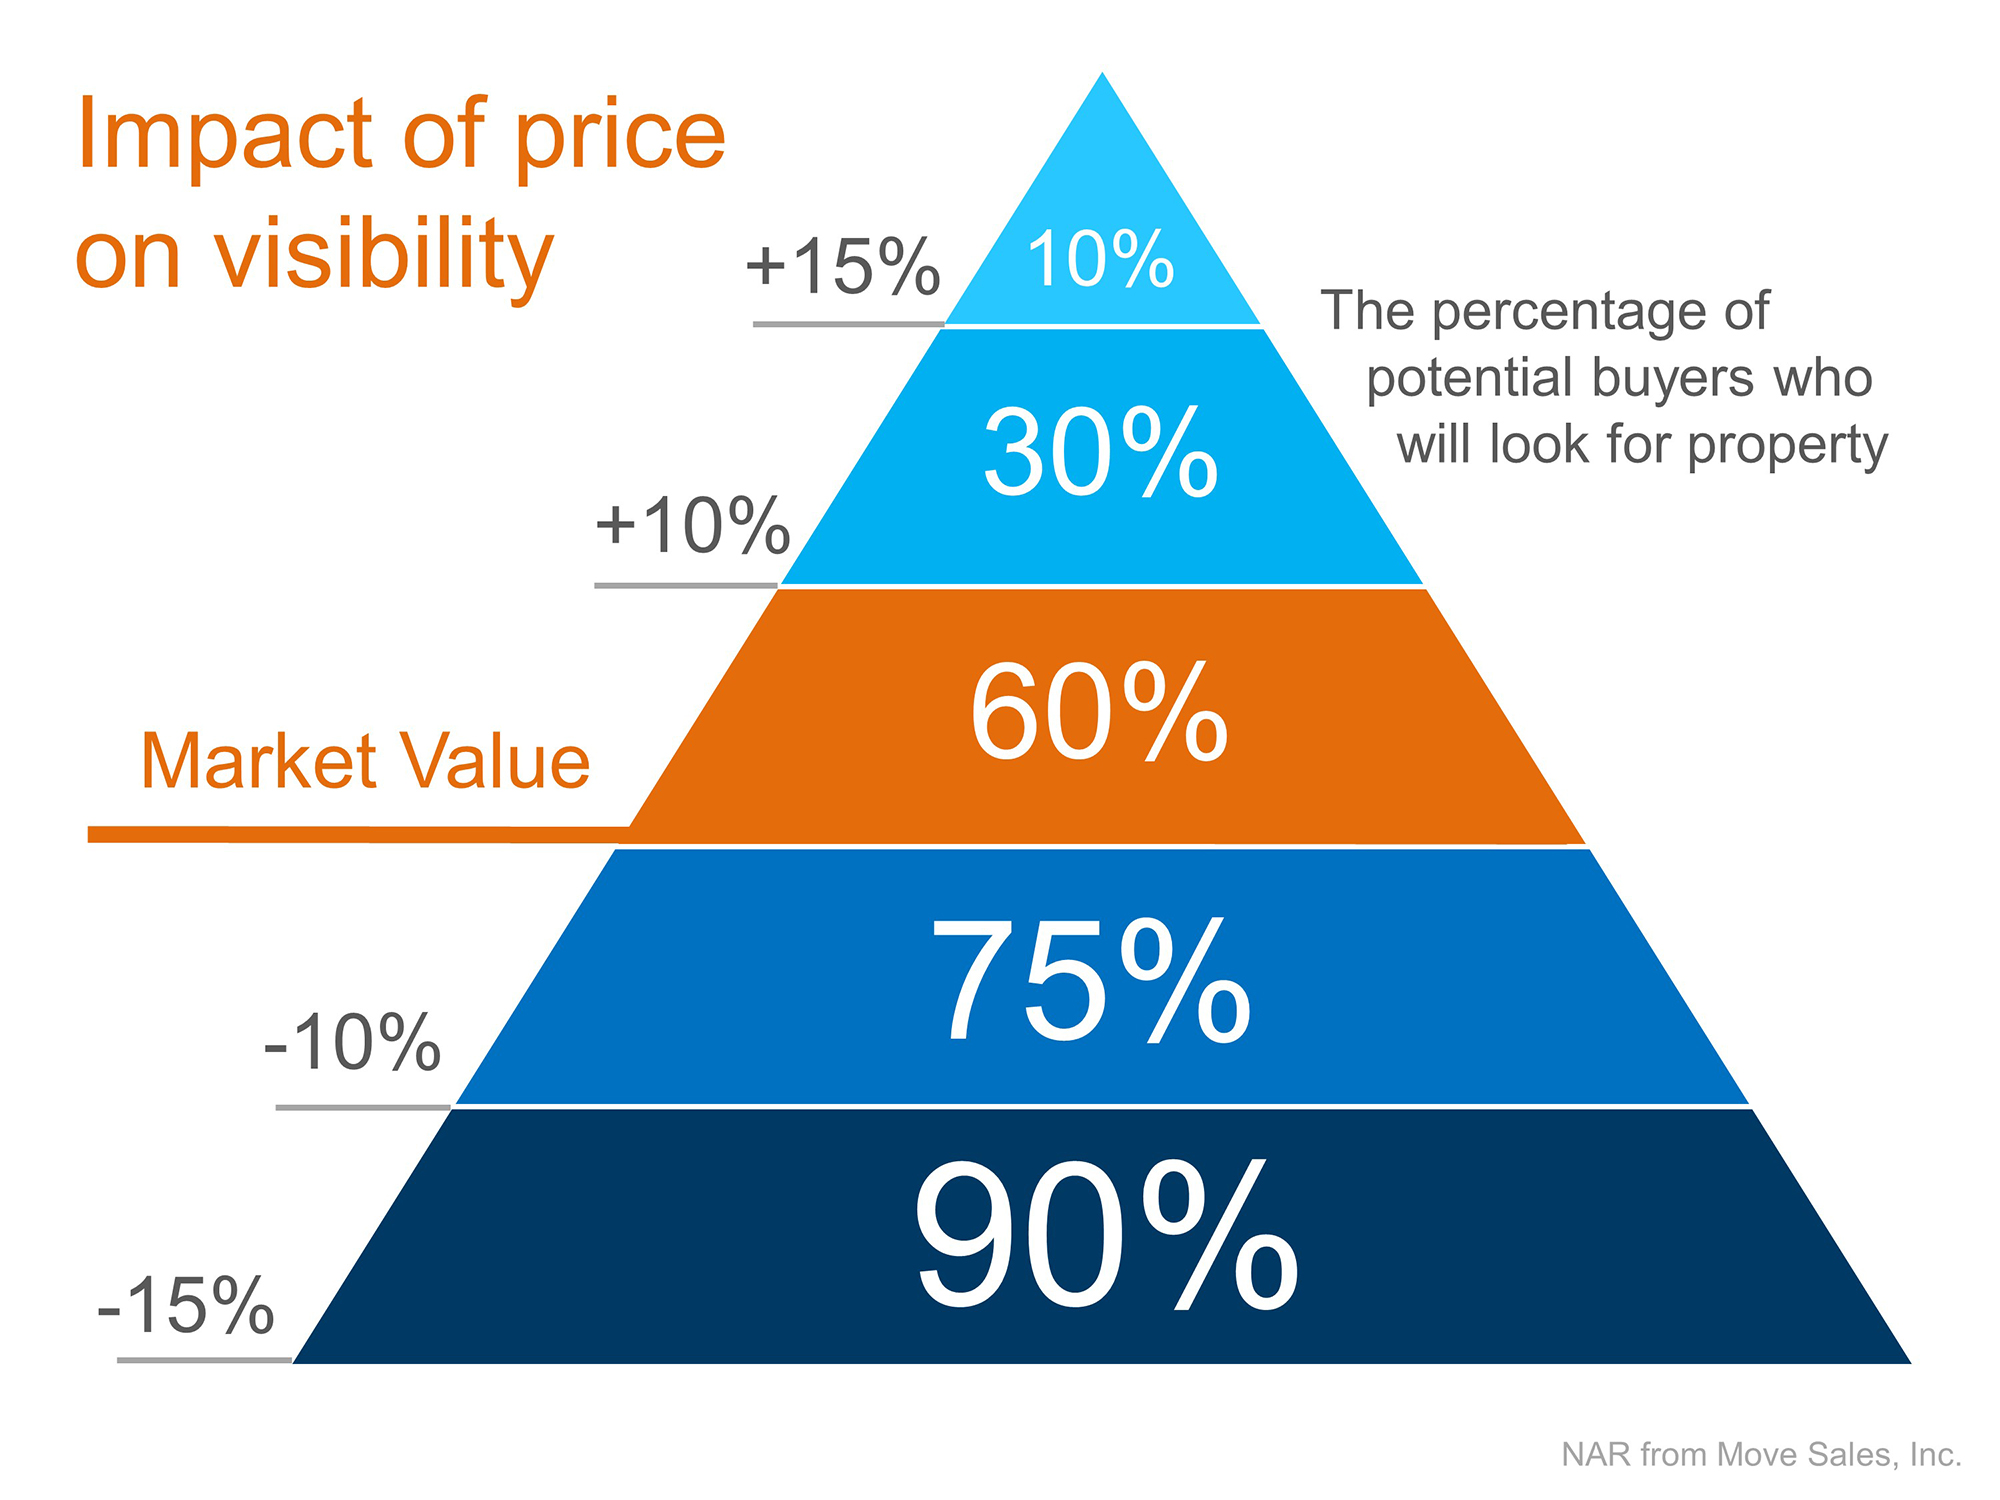
Conversely, between $500,000 and $1,000,000 a 21% Sales Ratio and almost 8 months of inventory is not a market condition that pushs prices up. Sellers here need to carefully evaluate their pricing strategy based on sound data that their broker can provide. If the Pierce County home is in the higher end, they are likely entering a market crowded with competition and it is worth considering the Impact of Price Visibility as shown on this chart;
The other take away I see in these numbers is the fact that if you're worried about finding your new dream home after selling the one you're in now, it may not be a concern if you are moving up into a larger or more deluxe dwelling.
In this ever dynamic market, sound professional advice and guidance is key to your real estate success. One newspaper or newscast headline does not fit all, and without local expertise with real time data it is easy to mis-step in such a fast paced real estate market.

 Facebook
 Twitter
 Pinterest
 Copy Link
